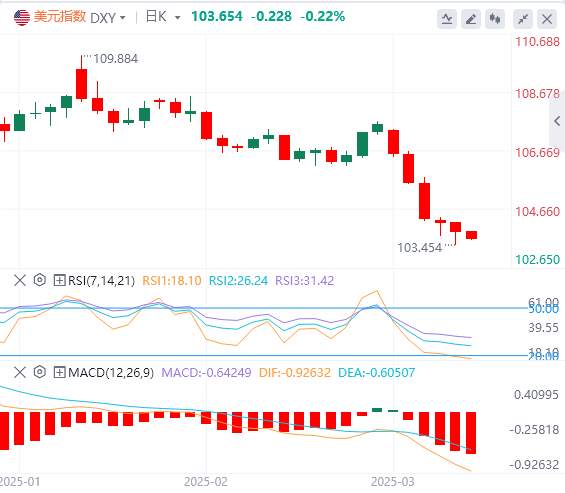
On March 10, Beijing time, in the early Asian session on Monday, the US dollar index hovered around 103.65. Last Friday, the slightly inferior non-farm data continued to support the Fed's expectations of multiple rate cuts this year. The US dollar index fell for five consecutive days, hitting a four-month low, but rebounded after Powell reiterated that he was not in a hurry to cut interest rates. It finally closed down 0.298% at 103.89, the largest single-week drop since November 2022. U.S. Treasury yields continued to rise after Powell's speech, erasing all intraday losses. The benchmark 10-year U.S. Treasury yield closed at 4.301%; the two-year U.S. Treasury yield, which is more sensitive to monetary policy, closed at 4.002%. Due to the inflow of safe-haven funds and the lower-than-expected growth of U.S. non-farm employment in February, spot gold stabilized at a high level and finally closed up 0.03% at $2,910.79/ounce, recovering to a positive weekly line. Spot silver closed down 0.31% at $32.53/ounce. Affected by the continuous bombardment of news headlines, the two oils have been on a roller coaster ride. After the US Department of Energy announced plans to prepare to replenish the SPR and Trump considered imposing large-scale sanctions on Russia, WTI crude oil surged 2% to a new intraday high. Then it was reported that Putin was ready to agree to a conditional ceasefire with Ukraine. WTI crude oil plunged during the session and finally narrowed its gains to 1.18% at $66.86 per barrel; Brent crude oil had a similar trend and finally closed up 1.31% at $70.19 per barrel.
US dollar index: As of press time, the US dollar index hovered around 103.65. The US dollar index fell to a four-month low on Friday, down 0.22% to 103.905, as weaker-than-expected employment data reinforced expectations of multiple interest rate cuts by the Federal Reserve. Technically, the nearest support for the US dollar index is in the 103.20–103.40 range. If the US Dollar Index falls below the 103.20 level, it will move towards the next support level of 102.00–102.20.
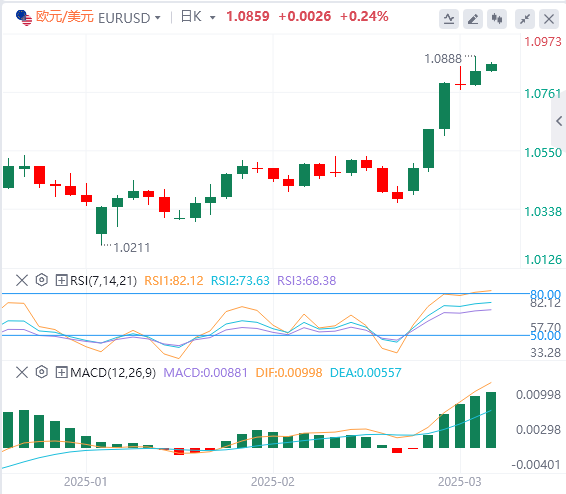
Euro: As of press time, EUR/USD is hovering around 1.0859. EUR/USD rose on Friday, closing at 1.0833, up 0.45%. EUR/USD started the week positively due to concerns about a possible slowdown in the United States (US) economy. San Francisco Fed President Mary Daly said late on Sunday that rising business uncertainty could dampen demand in the US economy, but does not justify a change in interest rates. Technically, if EUR/USD closes above the 1.0850 level, it will move towards the nearest resistance level of 1.0920–1.0935.
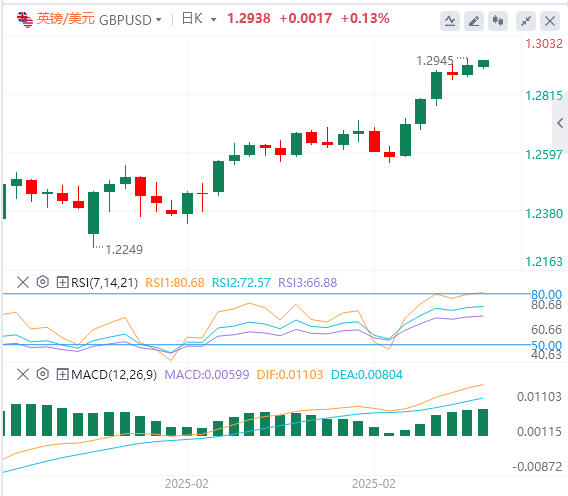
GBP: GBP/USD is hovering around 1.2938 as of press time. GBP/USD rose on Friday, closing at 1.2921, up 0.30%. The British pound (GBP) was supported by expectations that the Bank of England (BoE) would cut interest rates more slowly than other central banks, including the Federal Reserve. This proved to be another factor that contributed to the buying tone of the GBP/USD pair and validated the positive outlook. In the absence of any relevant market-moving economic data releases, whether from the UK or the US, the US dollar will continue to influence spot prices and allow traders to seize short-term opportunities. Technically, a successful test of the resistance level of 1.2935–1.2950 will push GBP/USD towards the next resistance level of 1.3050–1.3070.
Gold traded around 2915.81 in the Asian session on Monday. Last week, U.S. President Donald Trump issued an executive order on Thursday to exempt goods from Canada and Mexico two days after implementation under a North American trade agreement known as USMCA. However, U.S. Commerce Secretary Howard Lutnick said late on Sunday that the 25% tariff on steel and aluminum imports, which was scheduled to take effect on Wednesday, is unlikely to be postponed. Uncertainty surrounding Trump's tariff policy may promote safe-haven flows, which is beneficial to gold prices in the short term.
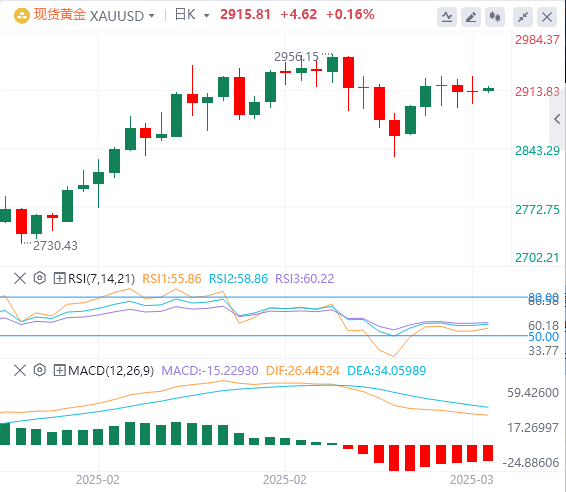
Technical: Technically, the market is still in a strong uptrend, but the closing price reversal top posted in the week ending February 28 has stopped the upward momentum. A trade above $2956.31 will offset the underlying bearish chart pattern and signal the resumption of the uptrend. Taking out $2832.72 will confirm the chart pattern. This could trigger a 2-3 week correction with the first target at $2746.58.
In the Asian session on Monday, crude oil traded near 66.58. Crude oil prices attempted to recover on Friday after a sharp sell-off, but ongoing supply pressures and geopolitical uncertainties kept the market bearish. Brent crude briefly edged higher after hitting multi-year lows, but resistance at $70 a barrel remained firm. Sentiment remained cautious as traders weighed OPEC+ production increases, the U.S. tariff dispute, and potential sanctions on Russian oil.
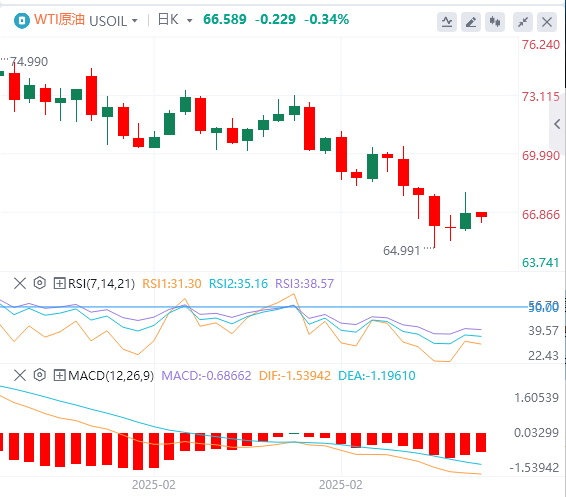
Technicals: Technically, the market is in a weak position after closing on the bearish side of the 50% level at $69.53 and $70.78. Both indicators act as resistance levels. WTI crude is also trading below its 52-week moving average at $71.24. The tone will remain bearish and traders may continue to sell rallies until the moving average indicators are surpassed.
To be determined US President Trump meets with US giant executives
15:00 German January seasonally adjusted industrial output monthly rate
15:00 German January seasonally adjusted trade account
16:00 Swiss February consumer confidence index
17:30 Eurozone March Sentix investor confidence index
23:00 US February New York Fed 1-year inflation expectations