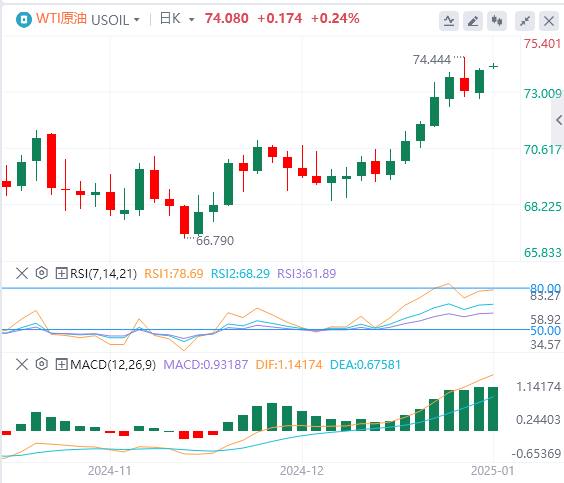
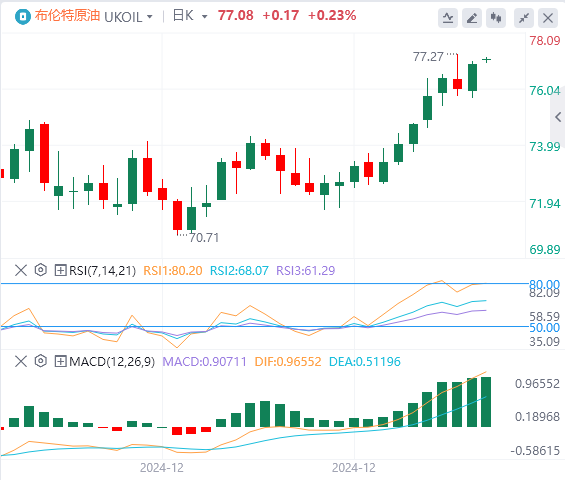
WTI prices rose slightly due to expectations of increased Chinese demand and a sharp drop in US crude oil inventories. As of now, WTI crude oil is quoted at $74.08 and Brent crude oil is quoted at $77.8.


The US JOLTs job vacancy data for November recorded 8.098 million, exceeding market expectations, and the previous value was revised upward
The ISM non-manufacturing PMI for December recorded 54.1, exceeding market expectations
After the data was released, traders no longer fully digested the bet that the Federal Reserve would cut interest rates before July.
API gasoline inventories in the United States for the week ending January 3 were 7.331 million barrels, with an expected 500,000 barrels and a previous value of 2.163 million barrels.
WTI crude oil technical analysis
During the U.S. trading session on Tuesday, WTI crude oil rose slightly and continued to fluctuate around the 200-day moving average. If it can break through this level, it will be a very optimistic signal. I think there is a high probability that oil prices will be able to break through, but as employment data continues to be released, I think the current consolidation pattern may continue for some time, with support at 72.50.
It is important to remember that oil prices began to rise at the end of 2024. I think this is a market response to U.S. inflationary pressures and the potential for continued economic recovery. Frankly speaking, the base of WTI crude oil is in the United States. The better the US economy is, the greater the demand for crude oil. Even if the oil price falls, the 50-day moving average can form an effective support. If the price can break upward, the bull target is at the 80 mark.
Brent crude oil technical analysis
The price trend of Brent crude oil is similar to that of US oil. Recently, it has been testing the resistance of the 200-day moving average. The difference between the two is that the market faced by Brent crude oil is broader than that of US oil. Therefore, I still think that Brent crude oil will perform weaker than US oil, and the upward target is the same as that of US oil. After reaching it, the rise may extend to 82.
On the downside, Brent crude oil has a lot of support near 74, and the important technical support 50-day moving average is also near this level. Recently, the two oils have mainly rebounded from the huge bottom support in the early stage. I think the current increase is still within a reasonable range.
Reuters Commodity and Energy Technical Field Market Analysts: Expected to rise to..., although the upside is limited
U.S. crude oil may rise from $68.42 per barrel to $75.64, completing wave C. This wave has again broken through the 138.2% forecast level of $74.58 and may extend to the 16.8% level of $75.64. A bearish divergence has formed on the hourly relative strength index, indicating limited upside. The current speculation is that the contract may extend gains to $75.64, but it is unlikely to break through this level on the first attempt. Support is at $73.93, a break below which may trigger a drop to $72.88. On the daily chart, resistance at $74.76 was weaker than expected and triggered only a small pullback, which has now almost reversed. The reversal indicates an incomplete uptrend, which may extend to the peak of wave (a) near $78.01.
On Tuesday, the price trend of WTI crude oil showed that the market demand for it is still strong, but whether it can continue to rise remains to be seen.
The daily chart shows that if the spot price of WTI crude oil can break through Monday's high of 75.19, it indicates that the overnight rebound will continue. There is a potential resistance zone above 75.78 to 76.47, which includes the 200-day SMA 75.85 and the 78.6% retracement level 76.57, which may form an effective resistance zone for oil prices to rise.
In addition, the 200-day moving average converges with the upper resistance of the large symmetrical triangle pattern. However, in the process of the continuous rebound of oil prices, the upward trend line is also compared with this level, and the resistance has been greatly strengthened, making it more difficult to achieve a breakthrough. At the same time, the 14-day RSI has reached its highest reading since April 2024, indicating that oil prices still have room to rise before entering the overbought zone. If you look closely at the price trend, you can find that when oil prices enter the above resistance zone, RSI also enters the overbought zone. At that time, you need to pay attention to the risk of a pullback.
If it is really blocked and falls back in this resistance zone, breaking below 73.29 will be an early sign of weakness. The key medium-term support is seen at 71.79 and the 20-day moving average of 70.94.
The US dollar is an important intraday driver of oil prices. After reaching its recent high, Brent crude oil may have some temptation to take profits, but if the US dollar weakens further, there may be more room for growth.
Brent is completely at the mercy of OPEC+, which plans to increase production in 2025, which somewhat limits the upside. But the group has proven its resolve several times in 2024, and the market may now be very confident that OPEC+ will increase production as planned in 2025 while keeping prices within an acceptable range of $70-80/bbl.
There are some fundamental strengths in the market that are driving oil prices higher. Saudi Arabia's increase in official selling prices for February further confirms this statement. There is no panic in the Saudi camp. This also shows that the physical crude oil market is quite solid in the first quarter of this year. Saudi Aramco can predict the market situation in the next 2-3 months through its customer orders around the world. Dubai crude oil spreads have already strengthened in December, and speculators may have taken the signal from this and started to build long positions. Since the low in mid-September, speculators have been increasing their positions throughout most of the fall.
U.S. Cushing crude oil inventories fell to a 17-year low, and global floating crude oil inventories fell sharply. This also added to the bullish side.