On January 2, Beijing time, in the early Asian trading on Thursday, the US dollar index hovered around 108.07. During the New Year's Day holiday, trading of precious metals, US crude oil, foreign exchange and stock index futures contracts under CME was suspended all day, Brent crude oil trading ended early, and the New York Stock Exchange was closed for one day. On Tuesday (December 31, 2024), as the Federal Reserve maintained interest rates at a higher level than other central banks, the US dollar index hit a two-year high of 108.59 and finally closed up 0.37% at 108.48. The benchmark 10-year US Treasury yield closed at 4.5760%; the two-year US Treasury yield, which is more sensitive to monetary policy, closed at 4.2520%. Spot gold closed up 0.71% on Tuesday at $2,624.61 per ounce, up more than 27% for the whole year, the largest annual increase since 2010. Spot silver closed almost flat, and finally closed down 0.13% at $28.89 per ounce. WTI crude oil closed up 1.02% at $71.81/barrel on Tuesday, while Brent crude oil closed up 0.99% at $74.80/barrel, as China's manufacturing activity expanded in December. Oil prices fell by about 3% in 2024, falling for the second consecutive year.
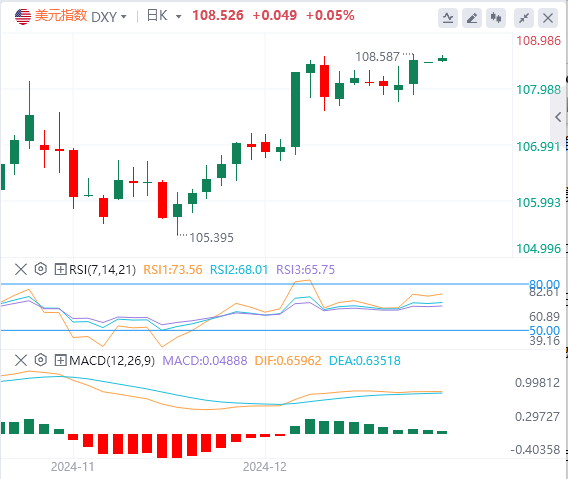
US dollar index: As of press time, the US dollar index hovered around 108.07. The US dollar has achieved annual gains against almost all major currencies, with an annual increase of about 7%, as the Federal Reserve will maintain interest rates higher than other central banks, which has led the US dollar to lead other currencies. Technically, the index traded above the 50EMA of $108.12 and the 200EMA of $107.51, indicating a short-term and long-term bullish trend. However, the double top pattern near $108.53 has added resistance, limiting the immediate upward momentum.
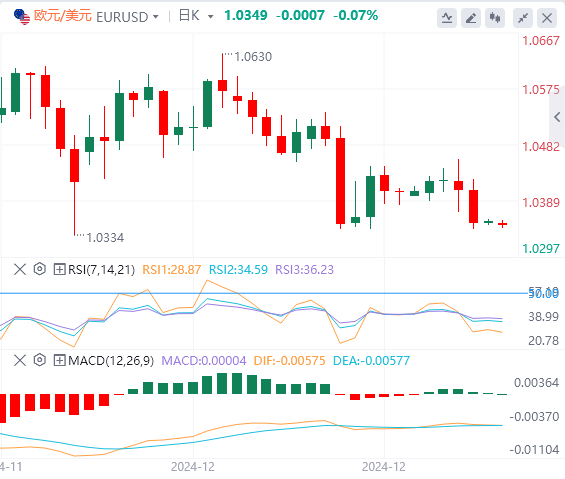
Euro: As of press time, EUR/USD hovered around 1.0349. EUR/USD fell on Tuesday, closing at 1.0353, down 0.51%. The European Central Bank (ECB) maintained a dovish guidance on interest rate policy next year, which put downward pressure on the euro and the EUR/USD currency pair. The ECB cut its deposit facility rate by 100 basis points (bps) to 3% this year and expects it to fall to 2% by the end of June 2025, which policymakers view as a neutral rate. This suggests that the ECB will cut its key borrowing rate by 25 basis points at each meeting in the first half of next year. Technically, the 4-hour chart shows a triple bottom pattern formed around $1.03448, indicating that if the pair stays above this area, a reversal is possible.
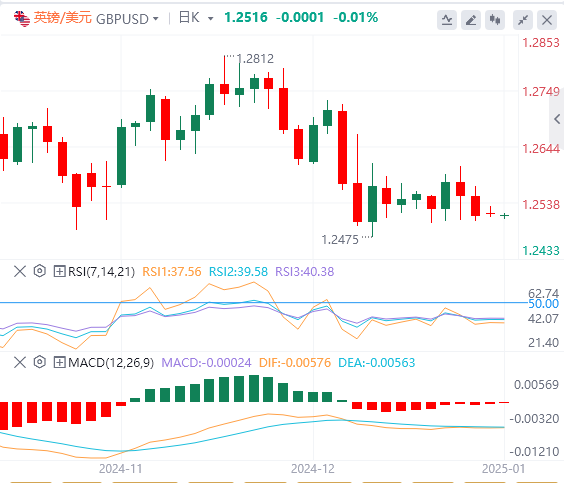
GBP: As of press time, GBP/USD hovered around 1.2516. GBP/USD rose on Tuesday, closing at 1.2531, down 0.31%. The pound came under pressure as traders slightly increased their dovish bets on the Bank of England (BoE)'s policy stance in 2025. Market expectations now reflect a 53 basis point (bps) rate cut next year, up from the 46 bps expected after the policy announcement on December 19, during which the BoE voted 6-3 to keep interest rates steady at 4.75%. Technically, the triple bottom pattern near $1.25067 offers a glimmer of hope for bulls, but the pair is below the 50EMA ($1.25476) and 200EMA ($1.26075), indicating that bearish sentiment currently dominates.
Gold traded around 2626.11 in the Asian session on Thursday. Uncertainties surrounding Donald Trump's tariff policy, geopolitical risks and central bank purchases supported gold. Nevertheless, the Federal Reserve's (Fed) cautious stance may limit gold's upside. Traders await new catalysts that could affect the Fed's interest rate outlook this year. In December, Federal Reserve Chairman Jerome Powell hinted at a cautious stance on further rate cuts after cutting interest rates by 25 basis points (bps). This, in turn, could provide some support to the dollar and weaken dollar-denominated commodity prices.
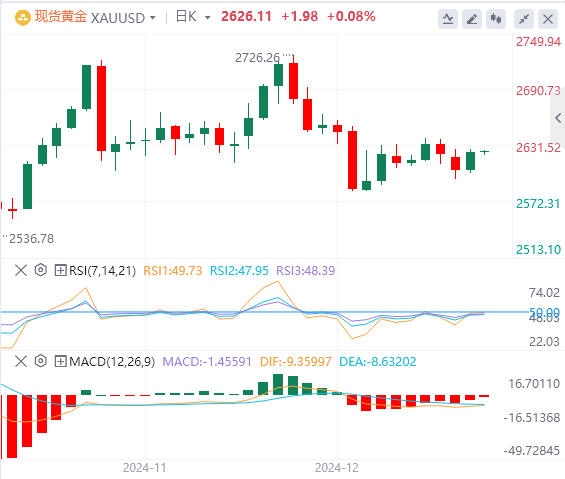
Technical: Gold's price action reflects its difficulty in breaking through major resistance levels. After reaching $2,790.17 at the end of October 2024, gold prices retreated to $2,536.85 in mid-November. Since then, gold prices have been trading in a narrow range between $2,536.85 and $2,721.42, with the 50-day moving average acting as a ceiling at $2,661.29. The 200-day moving average at $2485.95 remains a key support level, and a break below the current range would enhance downside risk.
Crude oil traded around 71.75 in Asian trading on Thursday. Most of the production growth in 2025 is expected to come from non-OPEC+ countries, with US shale oil, Brazil and Guyana leading the way. Global oil production is expected to increase by 1.6 million barrels per day, with nearly 90% of the growth coming from outside the OPEC+ group. In contrast, global demand is expected to grow by only 1.1 million barrels per day, driven by modest growth in Asia, especially India and China. This imbalance leaves room for surpluses, putting downward pressure on crude oil prices throughout the year.
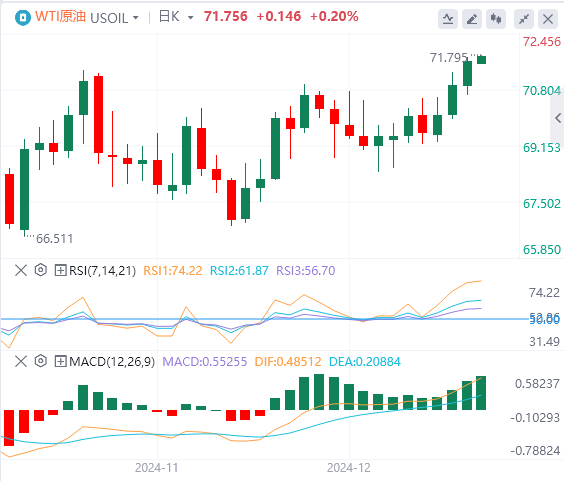
Technicals: WTI is expected to hover between $68 and $73, with resistance at $72.36. Traders should expect the $4-6 per barrel price spread to widen, reflecting stronger global demand for Brent compared to WTI's regional supply glut.
① To be determined, domestic refined oil will open a new round of price adjustment window
② 09:45 China's Caixin Manufacturing PMI in December
③ 15:00 UK Nationwide House Price Index Monthly Rate in December
④ 16:50 France's December Manufacturing PMI Final Value
⑤ 16:55 Germany's December Manufacturing PMI Final Value
⑥ 17:00 Eurozone December Manufacturing PMI Final Value
⑦ 17:30 UK December Manufacturing PMI Final Value
⑧ 21:30 Number of initial jobless claims in the United States for the week ending December 28
⑨ 22:45 Final value of the S&P Global Manufacturing PMI in December in the United States
⑩ 23:00 Monthly rate of construction spending in the United States in November
00:00 the next day EIA crude oil inventory in the United States for the week ending December 27
00:00 the next day EIA Cushing crude oil inventory in the United States for the week ending December 27
00:00 the next day EIA strategic oil reserve inventory in the United States for the week ending December 27