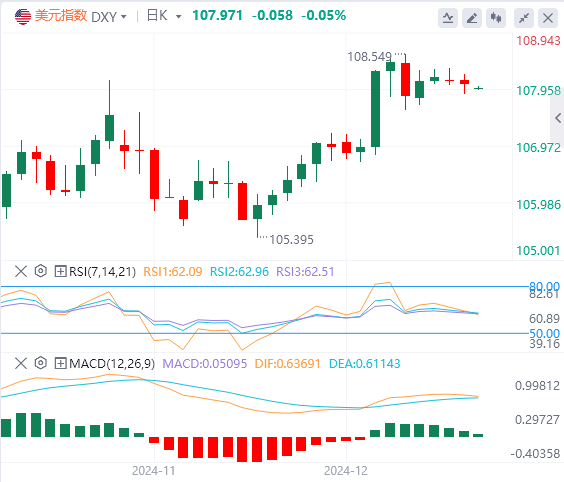
On December 30, Beijing time, in the early Asian session on Monday, the US dollar index hovered around 107.97. Last Friday, due to the uncertainty of the policies of the incoming Trump administration, the US dollar index remained volatile and finally closed down 0.06% at 108.03. U.S. Treasury yields rose across the board, with the two-year Treasury yield closing at 4.3340% and the 10-year Treasury yield closing at 4.6300%. Affected by the strengthening of U.S. Treasury yields, spot gold finally closed down 0.43% at $2,621.35 per ounce. Spot silver followed the rebound of gold and finally closed down 1.42% at $29.35 per ounce. Due to the larger-than-expected decline in U.S. crude oil inventories, WTI crude oil finally closed up 0.81% at $69.61 per barrel; Brent crude oil closed up 0.73% at $73.36 per barrel.
US dollar index: As of press time, the US dollar index hovered around 107.97. The market remains cautious, and light year-end trading conditions limit volatility. Data from Japan and China suggest that industry will slow further, but the dollar's upward momentum remains. Despite profit-taking after last week's gains, the dollar continues to climb as traders return from the Christmas holiday. Technically, if the US dollar index falls below the 50MA107.82, it will move towards the support level of 107.10–107.30.

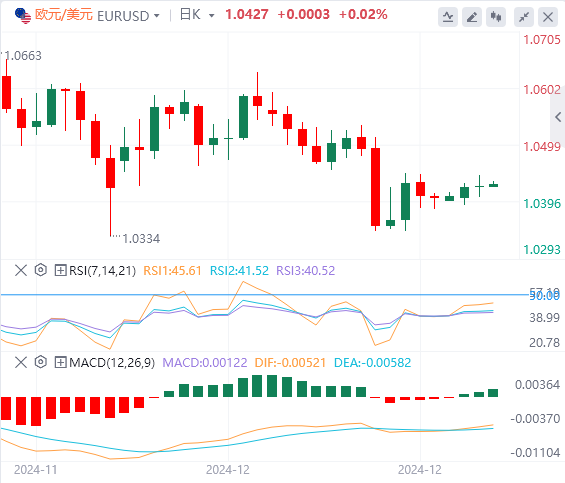
Euro: As of press time, EUR/USD hovered around 1.0427. EUR/USD rose on Friday, closing at 1.0424, up 0.01%. The European Central Bank (ECB) plans to continue cutting interest rates in 2025 in response to the eurozone's weak economy and uneven growth expectations, which puts the euro under further downward pressure. Technically, the euro remains sideways around 1.0400 and may fluctuate in this range in the short term unless there are major economic data or policy changes. Technically, EUR/USD is trying to close above the resistance level of 1.0435–1.0450. If this attempt is successful, EUR/USD will move towards the next resistance level in the 1.0525–1.0540 range.

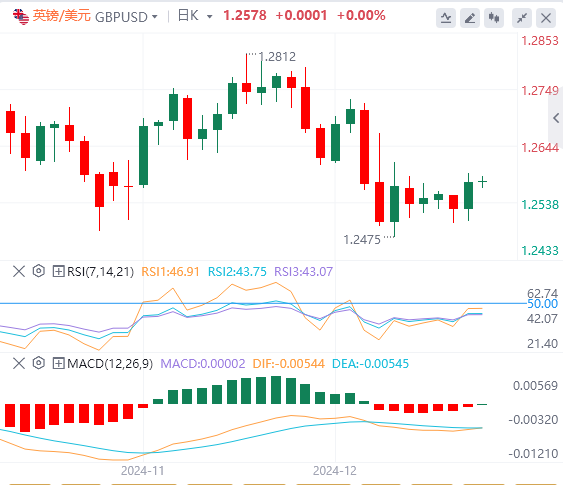
GBP: As of press time, GBP/USD is hovering around 1.2578. GBP/USD rose on Friday, closing at 1.2577, up 0.41%. . The GBP/USD pair rose as the dollar fell, with the US dollar index falling slightly to around 108.00. However, the outlook for the US dollar remains strong as investors still believe that the Federal Reserve (Fed) will reduce interest rate cuts in 2025. Technically, if GBP/USD successfully closes above the 1.2590 level, it will move towards the next resistance level of 1.2700–1.2715.

In the Asian session on Monday, gold traded around 2623.46. Donald Trump's tariffs and trade policies could spark trade conflicts, providing support for gold. However, the prospect of fewer rate cuts by the Federal Reserve in 2025 could curb the upside for gold prices. Trading volume was lighter than usual ahead of the New Year holiday.
Technical: Prices retreated as traders focused on rising Treasury yields and took some profits off the table before the New Year. If gold falls below the $2,610 level, it will move towards the nearest support level of $2,580–$2,590.
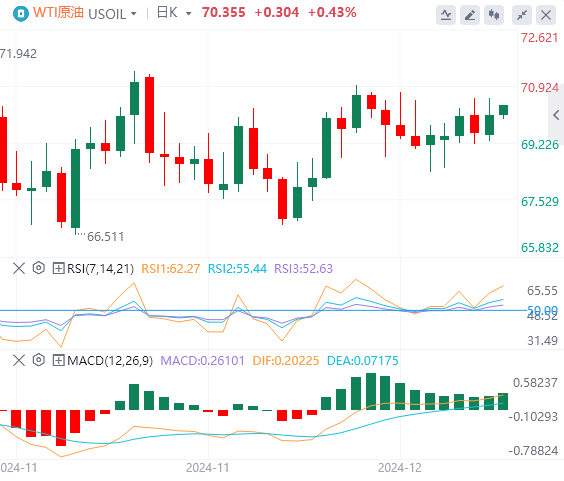
Crude oil traded around 70.35 in Asian trading on Monday. One of the main bullish drivers last week was a higher-than-expected drop in U.S. crude oil inventories of 4.2 million barrels. This exceeded the initial forecast and the API's earlier estimate of 3.2 million barrels. Stronger refinery activity and rising fuel demand during the holiday period led to a supply pullback, reinforcing the notion of tighter supplies. For traders, this suggests that underlying demand for crude remains solid even as broader economic uncertainty persists. With the U.S. the world’s largest oil consumer, continued inventory draws add a critical layer of support for prices heading into the new year.

Technicals: A break above the $70.50 level would push WTI crude toward the nearest resistance level, the $72.00 to $72.50 range.
①16:00 Switzerland December KOF economic leading indicator
②22:45 US December Chicago PMI
③23:00 US November existing home contract sales index monthly rate
④23:30 US December Dallas Fed business activity index