Wonderful Introduction:
The moon has phases, people have joys and sorrows, whether life has changes, the year has four seasons, after the long night, you can see dawn, suffer pain, you can have happiness, endure the cold winter, you don’t need to lie down, and after all the cold plums, you can look forward to the New Year.
Hello everyone, today XM Foreign Exchange will bring you "[XM Foreign Exchange Market Analysis]: The US dollar index temporarily holds the 100 mark, and US bonds have all emerged from the V-shaped market!". Hope it will be helpful to you! The original content is as follows:
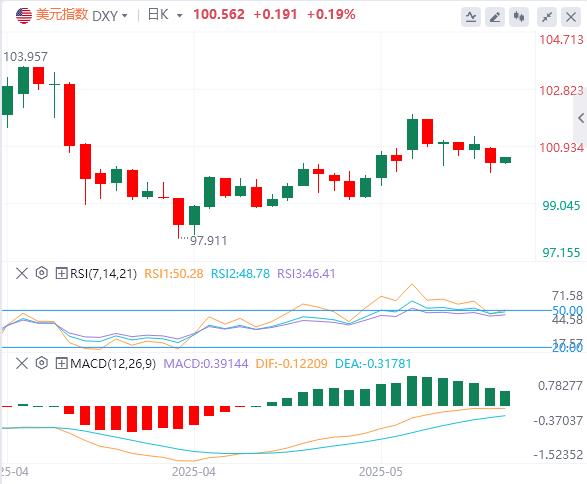
On May 20, early trading in the Asian market on Monday, Beijing time, the US dollar index hovered around 100.56. On Monday, the US dollar index fell sharply during the Asian and European sessions due to Moody's downgrade of the U.S. credit rating, and once fell nearly 100 mark during the session, but recovered some of the lost ground in the US session and finally closed down 0.62% to 100.37. U.S. Treasury yields across the board were all out of the V-shaped market, with the benchmark 10-year U.S. Treasury yields closed at 4.454%; and the two-year U.S. Treasury yields more sensitive to monetary policy closed at 3.979%. Spot gold fluctuated higher, approaching the $3,250 mark many times during the session, but failed to stand here and finally closed up 0.88% to $3,230.40 per ounce. Spot silver finally closed up 0.24% at $32.33 per ounce. Due to signs that the US nuclear negotiations with Iran seem to have broken down, the two oils rose slightly, WTI crude oil fell first and then rose, and rushed above $62 during the US session, finally closing up 0.3% to $62.05 per barrel; Brent crude oil closed up 0.05% to $64.93 per barrel.
Dollar Index: As of press time, the US dollar index hovers around 100.56. The market responded plainly to news that Trump announced the resumption of ceasefire negotiations between Russia and Ukraine. As Fed officials remain cautious and call for more clarity before pledging policy changes, the U.S. dollar index has struggled to find upward action energy. Technically, the dollar was sold off after Moody's downgrade and was skeptical of U.S. trade and debt policies. Break below 100 could fall further to 99.80 as investor confidence in U.S. fiscal management continues to be eroded.
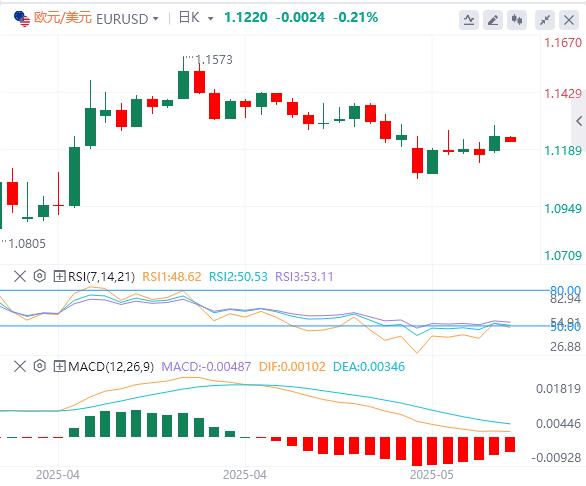
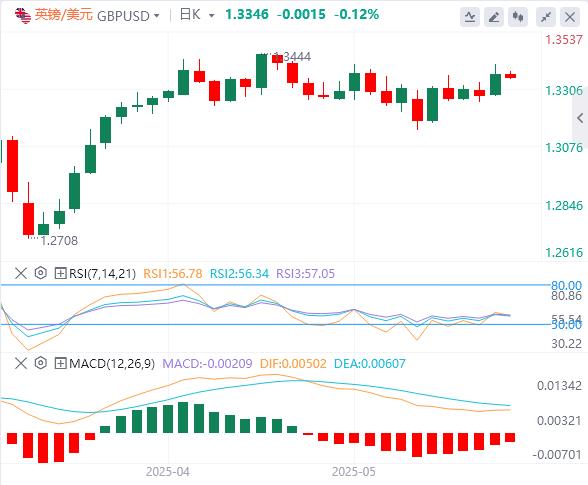
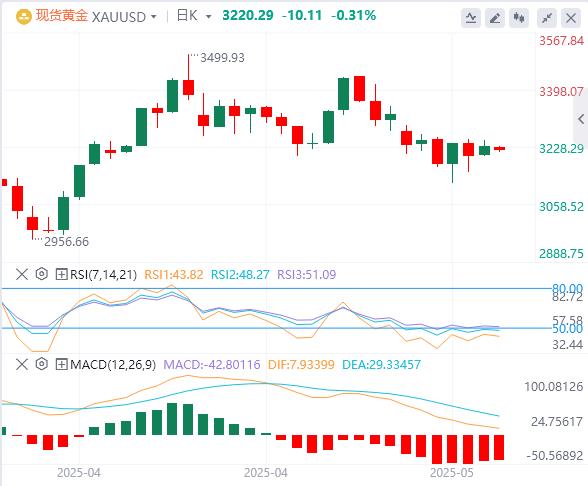
On Tuesday, gold trading around 3220.29. The market is looking forward to the Russian-Ukraine ceasefire after Trump and Putin's call on Monday, and concerns about the geopolitical situation have cooled down. Fed officials' speeches are hawkish, suppressing the Fed's expectations of a rate cut this year. This trading day will usher in the RBA interest rate resolution, and the market generally expects the RBA to cut interest rates by 25 basis points to 3.85%;In addition, the G7 Finance Ministers and the Governors' Meeting was held, and investors need to pay attention to it by May 22. U.S. President Trump will also participate in Congress on Tuesday's discussion of his comprehensive tax cut bill, as Republicans only hold a slim majority in the House of Representatives and will personally supervise the army to avoid misses in a key vote later this week. Investors need to pay attention.
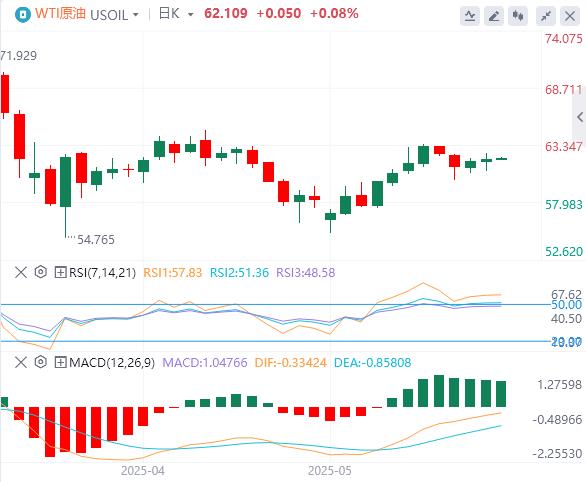
On Tuesday, crude oil trading around 62.10, domestic crude oil futures prices fluctuated slightly on Monday. The high-level economic and trade talks between China and the United States have made substantial progress and reached important consensus, and international oil prices have continued to rise. The global tariff war is gradually eased, and global oil demand has hope of recovery. Oil giant Saudi Aramco expects oil demand to remain resilient this year and will rise further if global trade disputes are successfully resolved. Pessimistic expectations of oversupply under the background of accelerated production growth of OPEC+, coupled with the promotion of geopolitical risks in negotiations between Russia, Ukraine and the United States, limiting the increase in oil prices. According to EIA data, as of May 9, the operating rate of US refinery rose by 1.2% month-on-month, continuing the recovery trend after maintenance season, higher than the average level in the same period in the past five years, driving a month-on-month increase of 330,000 barrels per day.
To be determined G7 Finance Ministers and Central Bank Governors' meeting was held
09:00 One-year loan market quotation rate from China to May 20
12:30 Australia to May 20 RBA interest rate decision
13:30 RBA Chairman Brock held a press conference
14:00 Germany April PPI monthly rate
16:00 Eurozone's current account after seasonal adjustment in March
20:30 Canadian April CPI monthly rate
22:00 Eurozone's initial value in May Consumer Confidence Index
The next day, the Federal Reserve Mousalem delivered a speech
The next day, the New York crude oil futures completed the last on-site transaction
The next day, the next day, the US crude oil inventories from the week of May 16
The above content is about "[XM Foreign Exchange Market Analysis]: The US dollar index temporarily holds the 100 mark, and the US bonds have fully emerged from the V-shaped market!", which was carefully compiled and edited by the XM Foreign Exchange editor, I hope it will be helpful to your trading! Thanks for the support!
Share, just as simple as a gust of wind can bring refreshment, just as pure as a flower can bring fragrance. The dusty heart gradually opened, and I learned to share, sharing is actually so simple.